I’ve recently finished reading The C Programming Language by Kernighan and Ritchie. One of the abilities that I had to develop to work through the exercises was debugging. I did it using gdb. In this post, I will explain how to debug using it with the Emacs code editor.

Emacs setup
I will give some specific explanations for the Emacs code editor. However, most explanations about debugging aren’t specific to it and should work the same on other editors.
If you don’t have it installed, you can do it with the following command on Ubuntu:
$ sudo apt-get install emacs
For other platforms, you can see detailed instructions here.
Configuration is saved in a file. Create a new file and name it init.el in the folder ~/.emacs.d.
In case you’re not familiar with it, ~ stands for home directory. It’s usually the folder /home/<user_name>.
Once the configuration file is created, we can add the following lines to it:
(require 'cc-mode)
(add-hook 'c-mode-common-hook 'electric-pair-mode)
The cc-mode comes by default with newer versions of Emacs. It gives all the basic functionalities we need to edit C code.
The electric-pair-mode will close parentheses for us automatically.
GNU Project Debugger (GDB)
As our debugging tool, we will use GDB. It comes with all the necessary tools for debugging and we don’t need to install anything for it to work with Emacs.
Sample code
To illustrate, we’ll use the following file bug.c:
#include <stdio.h>

/* Read one number per line from input.
   Print average */
int main()
{
  int sum, number, count;
  float average;

  for (count=0; scanf("%d", &number) == 1; count++)
    sum += number;

  average = (count != 0) ? (float) sum / count : sum;
  printf("The average is: %.1f\n", average);

  return 0;
}
It’s a simple program that reads numbers from stdin (user input from the keyboard). When the input is not a number or the user signals EOF (it can be done by pressing CTRL+D) scanf will not return 1. Then the program continues its execution and prints the average of the numbers.
At first glance, the program seems to be correct. We compile it with:
$ gcc bug.c -o main
It compiles without errors. But when we run it we get unexpected results:
$ ./main
1
2
The average is: 10974.5
To find out what went wrong, we’ll debug it with gdb.
Compiling for debugging
First, we need to compile our file with a special flag -g in order to be able to debug it:
$ gcc bug.c -g -o main
Then we open the compiled file with Emacs:
$ emacs main
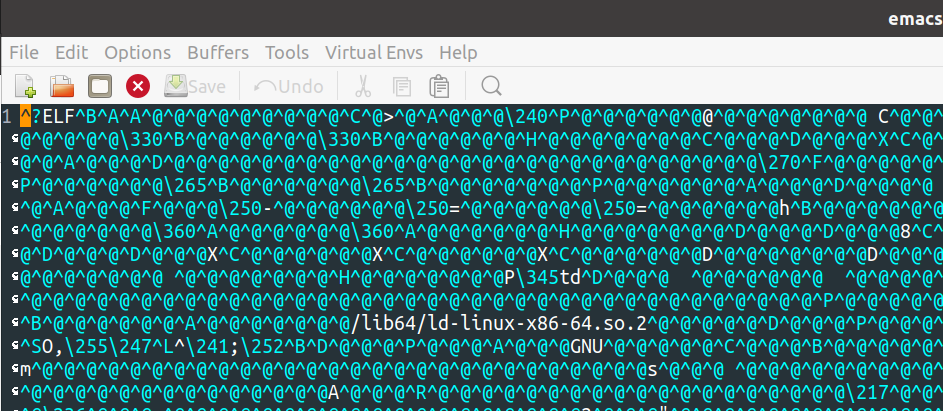
We’ll get a window with a lot of unreadable characters.

We can run gdb from Emacs with the command M-x gdb.
Detailed explanation: M (meta key) is the alt key. M-x means to press M and, without releasing it, press x. This will open a command line at the bottom of the window. Here we type gdb. We execute it by pressing RET (return/enter key). We’ll be asked how to run the file. We can leave the options as they are and press RET again.
The window will now open gdb.

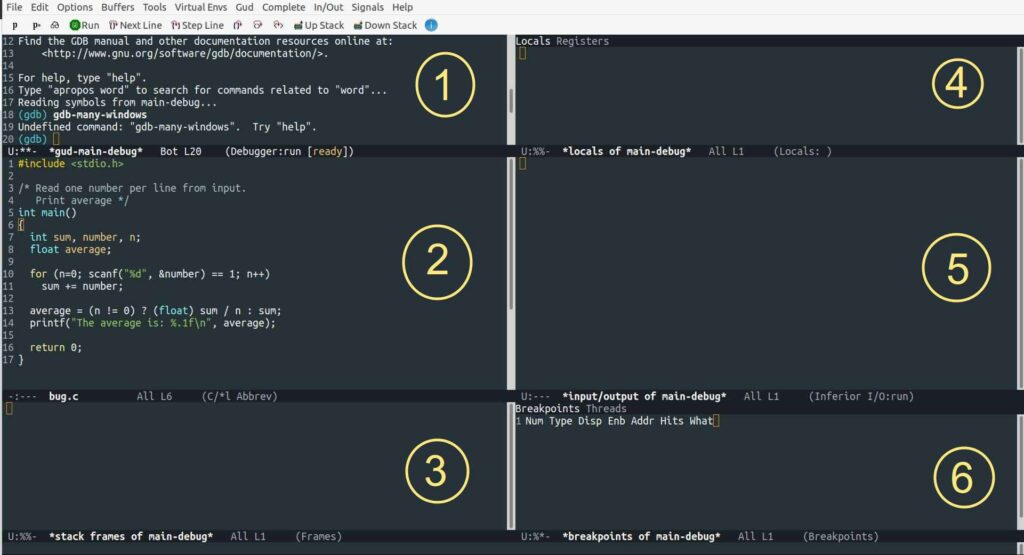
Here we can activate a more useful layout with the commandM-x gdb-many-windows (again M is the alt key, not capital “M”). Execute the command with the return RETkey.
GDB User layout
After executing the last command, the layout will change to a more useful one.

At this point we’re ready to start debugging.
Debugging
All commands go on the top-left corner (window 1), just after (gdb).
First, we need to set a breaking point. We do it with:
(gdb) b 7
This will set a breakpoint at line 7 of our file.
A red dot will show next to the line where our code will stop.
We can start running our program with:
(gdb) run
Gdb will start the execution of the program and halt it at any breaking point. A white arrow will indicate the line of code gdb is at.
To advance we have two commands s and n:
sstands for step. If the current line is a function call, it will continue with the first line of the function.nstands for next. It will continue to the next line of code without entering function calls. If the current line is a function call, it will continue execution until it has returned a value.
Additionally, we can specify how many lines to advance with s and n. The following command will advance 5 lines of code:
(gdb) n 5
s 5 would do the same but it will enter any function calls in those lines and count code lines inside those functions.
If we enter a function call, we can exit with fin.
For instance, if we press s when we’re at the line with the function scanf of our code, we’ll enter the function call to scanf.

Since we aren’t interested in debugging C library functions, we step out of scanf with (gdb) fin.
In this specific case, gdb will be unable to advance to the next line of code because scanf is waiting for input. We can give input from the input/output window (5 on the figure above).
We just type a value in window 5. After accepting it by pressing return, (gdb) will continue on window 1.
Finding the bug
Now that we’re more familiar with the layout and commands, we can focus on the actual bug.
At any point in the execution of our program, the values of the variables in the current namespace will be shown on window 4 (top-right):

Here we can see that we didn’t consider that all local variables in C are initialized to undefined (garbage) values. This is particularly important for the variable sum that accumulates the sum of the input numbers.
We can easily fix this issue by initializing our variable when we declare it:
int sum=0, number, n;
After compiling and executing the modified version of our program we get:
$ ./main
1
2
3
The average is: 2.0
Which is the expected behavior.
While this bug was very simple, it gave us the opportunity to see how to debug using gdb on Emacs.
To finish, we’ll see some extra functionalities of gdb.
Getting input from file
We can redirect stdin to come from a file instead of the keyboard by using the < operator. From the gdb command line:
(gdb) run < input.txt
Then we continue debugging as we’d normally do. Any time the code requires any input from stdin, it will get it from input.txt.
Setting command-line arguments
We can debug programs that accept command-line arguments with the set args command:
(gdb) set args <arg1> <arg2> ... <argn>
For instance, we could have our program calculate the average of all numbers passed as command-line arguments.
$ ./main 1 2 3
The average is: 2.0
In that case, before running gdb, we would do:
(gdb) set args 1 2 3
Only then would we start debugging:
(gdb) run
Printing
We can print the value of any expression with p.
To print the value of a variable:
(gdb) p sum
It works with function calls (or any valid expressioon) as well:
(gdb) p pow(2, 2)
(The above command will work only if your code has included the math.hlibrary on compilation)
With this, we have finished this introduction to gdb using Emacs. Besides these commands, there are many more. Just to mention one of them, it’s possible to set breaking points only under some conditions (like when a variable is equal to a certain value).
Thanks for good job
You are welcome.